Wednesday, May 31, 2017

Show Me Button Missing From Toolbar

In Tableau Desktop Version 10 you may observer that "ShowMe" button will not be display. Up on multiple installs and re-installs it will not appear. Its because, show me exists but its not displayed.
Solution to address this is to increase the resolution of the Laptop/ Desktop Screen.
This is the solution I have provided to Tableau vendor team. And the same you can see it on their portal as well.

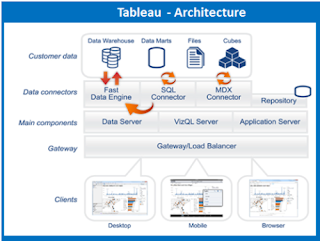
Tableau Architecture.


Tableau  Architecture.

It is Client and Server based N-Tier Architecture. We build Tableau reports in using Tableau Desktop and deploy them to Tableau Server.
Tableau Server runs on 3 difference services.
Visual Server: This sends the queries to database and then coverts it to the visuals/Images you see in tableau.
Database/Repository Server: This manages the connectivity and maintains the data extracts.
Application Server: This handles the Authentication and Authorization.

Tableau Server architecture supports fast and flexible deployments.

The following diagram shows Tableau Server’s architecture:


Tableau Server is an enterprise class business analytics platform to level up thousands of clients. Tableau Server presents powerful mobile and browser-based analytics and workings among a company’s presented data strategy and security protocols.
Tableau Server:

  • Scales up: Is multi-threaded
  • Scales out: Is multi-process enabled
  • Provides integrated clustering
  • Supports High Availability
  • Is secure
  • Runs on both physical and Virtual Machines


Tableau Interview Questions Set 2


Differentiate heat map and tree map?
Heat maps is a type of data visualization in which up to two measures can be displayed by using size and color to express the values. It enables easy comparison of categorical values using color ranges
Tree maps A tree map is designed to display hierarchical data as rectangles within rectangles. For each rectangle, two measures can be coded—one will affect the size of a rectangle, and the other will affect color.


How can we combine database and flat file data in tableau desktop?
Connect data two times, one for database tables and one for flat file ( you can copy paste the data from flat file) . The Data-> Edit Relationships
Give a join condition on common column from db tables to flat file.

What are Dimensions and Facts?
Dimensions are the fields that help us to categorize the dataset/facts. For example, sum of sales by each state or segment; here, state or segment is a dimension, where as Facts are measures or numbers which helps us .


What type of join you see in data blending?
Left join


What is forecasting?
Based on historic data prediction is performed by tableau


What are LOD’s and why they are useful?
Aggregate (exclude) and disaggregate(Include) the data.


What are tooltips and why they are useful to create in a view?
To give a summarize data ( Quick details of the data points)


I have a dataset, which has measure sales and category as dimension. Show negative values as red and positive values to green for each category.
Method 1: (Use a calculated field “ if loop” ) .
Method 2: Modify colour legend for profit, because sales can’t be in negative.


I have a dataset, which has got nulls. I want to replace null with ‘0’(Zero). How can I achieve this?
-Zn([Sales]) or ifnull([Sales], 0)


While creating a calculated field I see “ Cannot mix aggregate and non-aggregate arguments” as error. How can you prevent this error?
- Aggregate the non- aggregate field.


Can we transpose data in tableau? No , not possible.


How many ways you can create filters/Types of filters? -6 Filter types.
Data source / Extract filter / context / Dimension / Measure / Tableau Calc / Set / Action Filters/


I have different measures in my data pane. I want to create a view where I can swap the measures. How can we achieve this? - Uses measure filter.


Can we use parameter as a filter?
NO. But we can use a calculated field if required.


How would you create top N sales. Where N should be dynamic parameter.
Select the dimension field, put it in filter >> go to TOP >> select by field >> top  >> create parameter .


What is the calculation you would write YTD,MTD.
Order date >=datetrunc( ‘year’, today()) >>> put this calc field in filter and select True. >>>
Order date >=datetrunc( ‘month, today())

How can I remove “ABC” default text placeholder?
Create a blank field and right click and place it there and select( Attr(blank)) .

Tableau Interview Questions set 1


What is data visualization?

  A much advanced, direct, precise and ordered way of viewing large volumes of data is called data visualization. It is the visual representation of data in the form of graphs and charts, especially when you can’t define it textually. You can show trends, patters and correlations through various data visualization software and tools; Tableau is one such data visualization software used by businesses and corporates. 


Difference between Discrete Vs Continuous ?
Continuous means "forming an unbroken whole, without interruption"; discrete means "individually separate and distinct." In Tableau, fields can be either continuous or discrete. When you drag a field from the Measures area to Columns or Rows, the values are continuous by default


What is the default data blending join?
 A default blend is equivalent to a left outer join.


What is page shelf?

Page shelf is power full part of tableau that you can use to control the display of output as well as printed results of output.


Difference between groups and sets?
Group: Simplifies large numbers of dimension members by combining them into higher-level categories.
Set: A subset of your data that meets certain conditions based on existing dimensions.


What is a Filter?
A dimension or measure that narrows the data shown in a view to focus on relevant information.


What are parameters?
Parameters are dynamic values that can replace constant values in calculations and can serve as filters.


Difference between data blending and joins?
Joining is where you are able to combine data from the SAME data source, for example worksheets in an Excel file or tables in an Oracle database. You need a common field, also called a key, that tells Tableau how to join the data. You also need a key to do blending.


Performance tuning in tableau Desktop.
Performance testing is again an important part of implementing tableau. This can be done by loading Testing Tableau Server with TabJolt, which is a “Point and Run” load generator created to perform QA. While TabJolt is not supported by tableau directly, it has to be installed using other open source products.


What is context filters?
The concept of context filter in Tableau makes the process of filtering smooth and straightforward. It establishes a filtering hierarchy where all other filters present refer to the context filter for their subsequent operations. The other filters now process data that has been passed through the context filter.
Creating one or more context filters improves performance as users do not have to create extra filters on large data source, reducing the query-execution time.
You can create by dragging a filed into ‘Filters’ tab and then, Right-Click that field and select ‘’Add to Context”


What are different file extensions in tableau?
 There are a number of file types and extensions in Tableau:

Tableau Workbook (.twb)
Tableau Packaged Workbook (.twbx)
Tableau Datasource (.tds)
Tableau Packaged Datasource (.tdsx)
Tableau Data extract (.tde)
Tableau Bookmark (.tbm)
Tableau Map Source (.tms)
Tableau Preferences (.tps)


Tableau Files and File types

• Workbooks
–Tableau workbook files have the .twb file extension and are marked with the workbook icon. Workbooks hold one or more worksheets and dashboards.
• Bookmarks
–Tableau bookmark files have the .tbm file extension and are marked with the bookmark icon. Bookmarks contain a single worksheet and are an easy way to quickly share your work.
• Packaged Workbooks
–Tableau packaged workbooks have the .twbx file extension and are marked with the packaged workbook icon. Packaged workbooks contain a workbook along with any supporting local file data sources and background images. This format is the best way to package your work for sharing with others who don’t have access to the data
Data Extract Files
–Tableau data extract files have the .tde file extension and are marked with the extract icon. Extract files are a local copy of a subset or entire data source that you can use to share data, work offline, and improve database performance.
Data Connection Files
–Tableau data connection files have the .tds file extension and are marked with the data connection icon. Data connection files are shortcuts for quickly connecting to data sources that you use often

Tuesday, April 11, 2017

Tableau Products and its discription in breif

Tableau offers 7 products which can be broadly categorized into:

1.       Tableau Development Tools
a.       Tableau Desktop Pro      b. Tableau Personal        c. Tableau Public

2.       Tableau Servers
a.       Tableau Server (Enterprise)        b. Tableau Online (Cloud)             c. Tableau Public

3.       Tableau Reader

Tableau Development Tools:
All your reports/dashboards development are done here. From creating reports, charts, formatting them, putting them together as a dashboard all the work is done using any of the Tableau report development tools.
Tableau Desktop Pro: This is fully-featured development tool with access to connect to most the available data-sources. Tableau has its own set of drivers for major data-sources, however, they do provide access to make ODBC connections to connect to the data-sources which are not listed in their pre-defined connection list.
It allows us to save the dashboards locally or publish to Tableau Server, Tableau Online or Tableau Public server to share and collaborate.
Tableau Desktop Personal: Like Tableau Desktop Pro, this too has all the development functionalities except, it allows connection to only file-based data sources and to save the dashboards locally. You cannot publish the dashboards/reports on servers.

Tableau Public: This is a free product from Tableau. It too has all development functionalities but it won’t allow you to save the dashboard locally. Visualization Enthusiast can play with data using Tableau Public. It has its limitation. You can only use limited data(1 million row or 4 GB), can only connect excel or text file (no database connectivity) & anything you save in Tableau Public will be saved on Tableau Public Server which anyone can download (no confidentiality). You need to have a Tableau Public server account and publish the dashboards under your account on cloud.

Tableau Server: The dashboards you create are shared with other users using Tableau Server. When you upload (publish) a Dashboard to Tableau Server from Tableau Desktop, other users can access those Dashboards by logging on Tableau Server.

Tableau Public: It's a free product from Tableau. Visualization Enthusiast can play with data using Tableau Public. It has its limitation. You can only use limited data (no. of rows), can only connect excel or text file (no database connectivity) & anything you save in Tableau Public will be saved on Tableau Public Server which anyone can download (no confidentiality).

Tableau Online: It's an alternative to Tableau Server in which the servers are on Cloud. Servers are not maintained by users but by Tableau guys. Needs subscription fees.

Java Scripting fun with Tableau

Here is one of the JavaScript I am listing below which will pop-up and will allow you to download the .CSV file of the dashboard you are v...